Credit_Card_Transactions
Overview
Introduction
This project analyzes credit card transactions to develop a machine learning model for fraud detection. The project includes data preprocessing, Exploratory Data Analysis, and the development of a Decision Tree model. Model performance is evaluated using accuracy and other key metrics, with feature importance analysis to identify factors contributing to fraud.
Data Used
The Dataset consists of 1.3 Million credit card transaction records, including various features such as:
- Transaction details: Date, time, merchant, amount, and transaction location.
- Cardholder information: Gender, age, job, and geographic location.
- Fraud label: A binary indicator (is_fraud) that marks transactions as fraudulent (1) or non-fraudulent (0).
The data was downloaded from Kaggle
Tools
- Python
Questions
- What is the spending behavior in Not Fraudulent transactions.
- What are the key features that help distinguish between Fraudulent and Not Fraudulent transactions?
- During which times of the day do Fraudulent transactions most commonly occur?
- What are the most frequent transaction amounts for Fraudulent activities?
- Which merchant categories experience the most Fraudulent transactions?
- How does the transaction amount differ between Fraudulent and Not Fraudulent transactions?
- What days of the week are Not Fraudulent transactions most frequent?
- What time of day are Not Fraudulent transactions typically made?
- How accurate would a machine learning model be in predicting Fraudulent transactions?
- What features contribute most to predicting fraud?
Skills
- Data cleaning with Pandas.
- Data consistency checks.
- Statistical analysis.
- Grouping and Aggregating data.
- Data Visualizations with Plotly and Matplotlib.
- Machine Learning: Decision Tree with Scikit.
Goals
- Conduct Exploratory Data Analysis (EDA).
- Provide a clear understanding about the characteristics of Fraudulent Credit Card Transactions.
- Analyze spending behavior.
- Identify what features are more relevant in a model to target Fraudulent Credit Card Transactions, using Machine Learning.
- Provide conclusions and insights.
Analysis
Missing and Duplicated values
After validation, no missing or duplicate values were found, allowing us to proceed with Exploratory Data Analysis.
The data was divided into Fraudulent and Not Fraudulent transactions, in order to analize Spending Behavior.
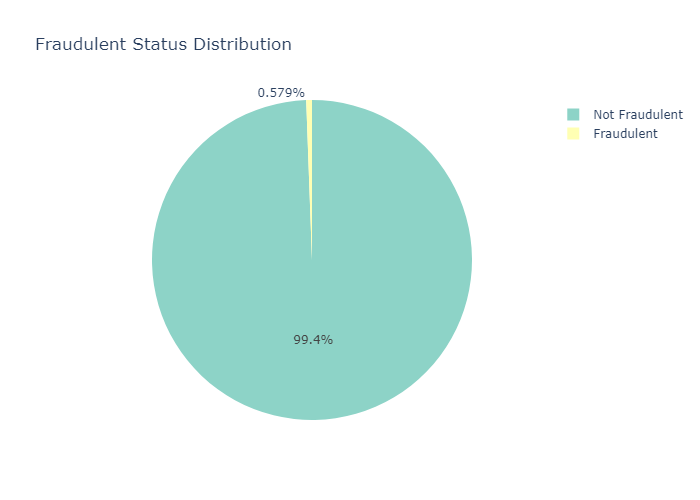
The majority of transactions are labeled as Not Fraudulent.
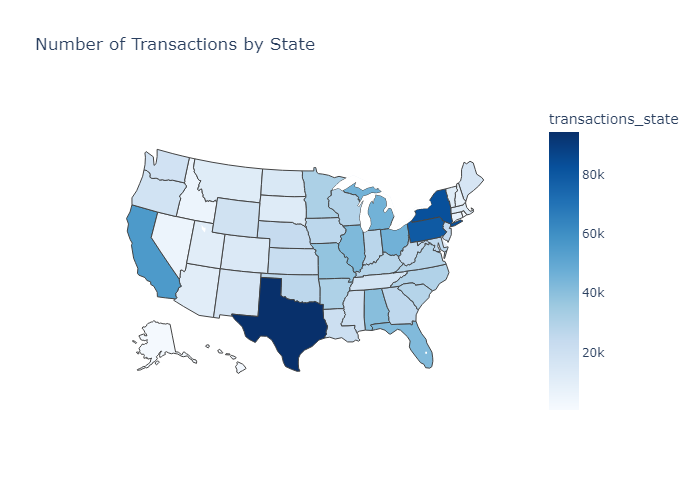
The majority of Not Fraudulent transactions in the dataset are located in the State of Texas.
Spending Behavior
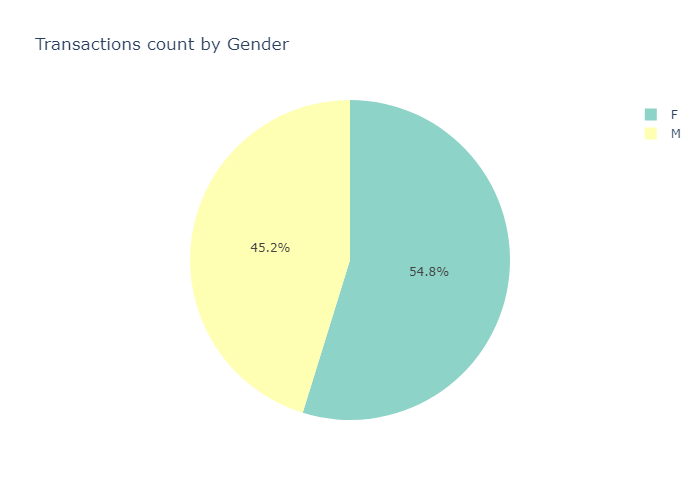
There is a higher count of transactions made by Female customers, as well as a higher amount spent by the same gender.
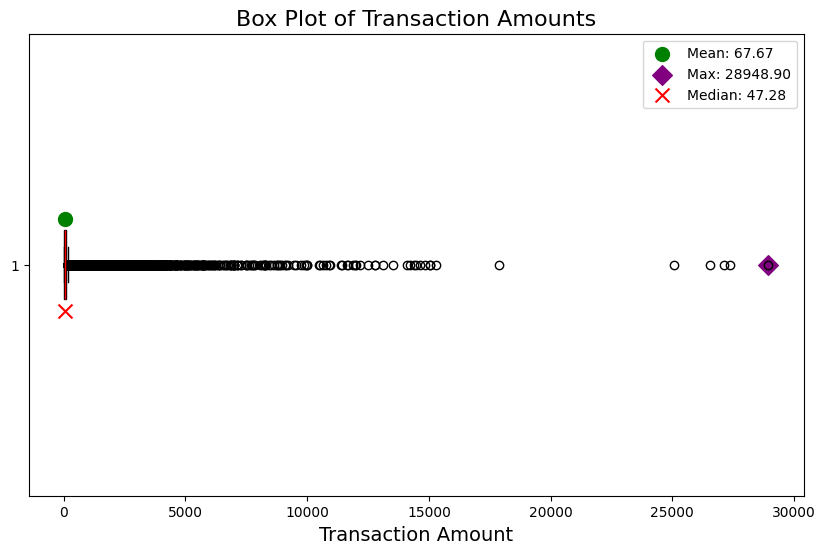
For Not Fraudulent transactions the Average is 67 USD and the Median is 47 USD.
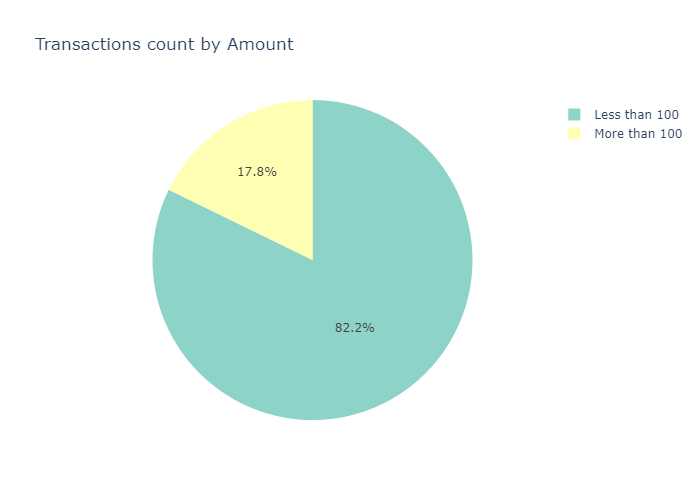
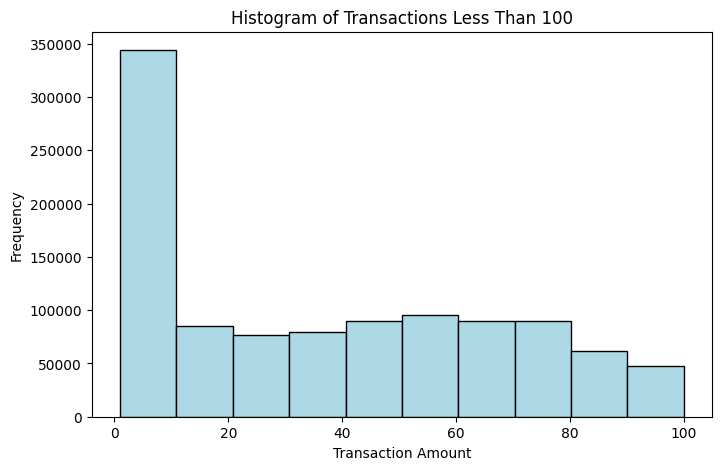
The majority of transactions (82%) are made for charges of less than 100 USD. Furthermore, most of of them are for charges of less than 10 USD.
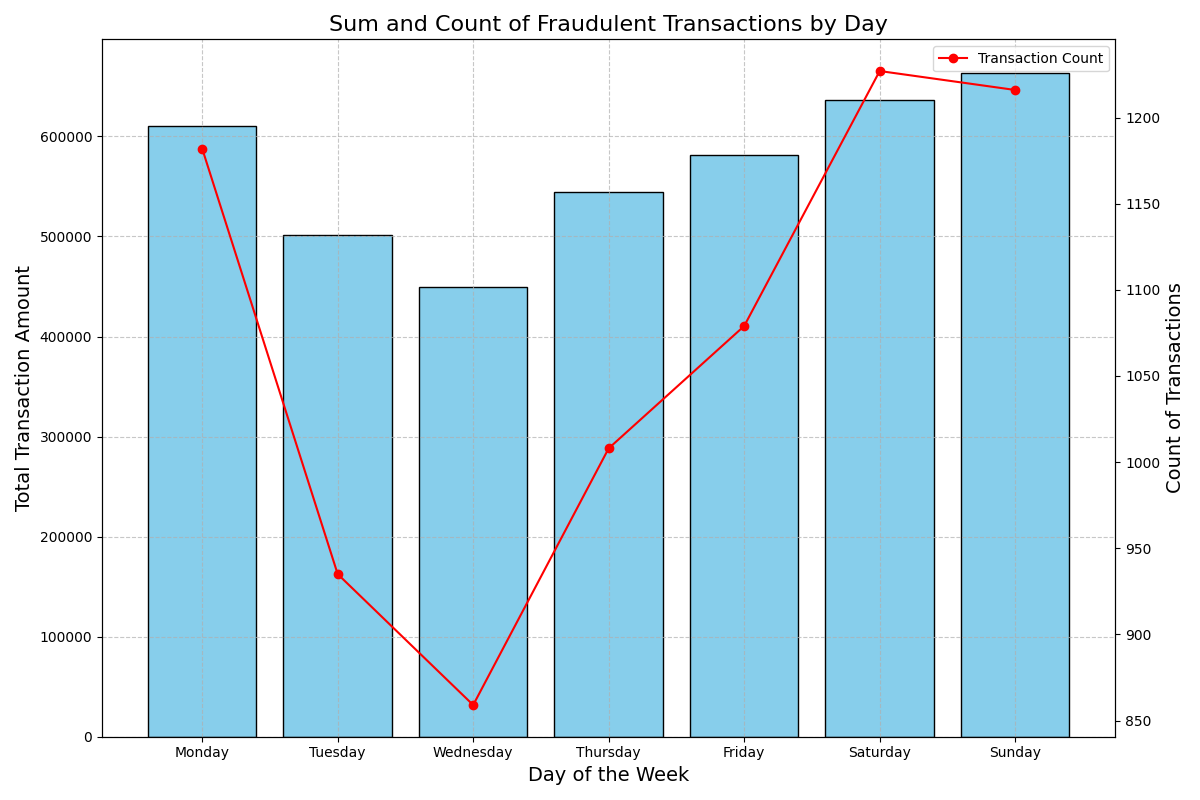
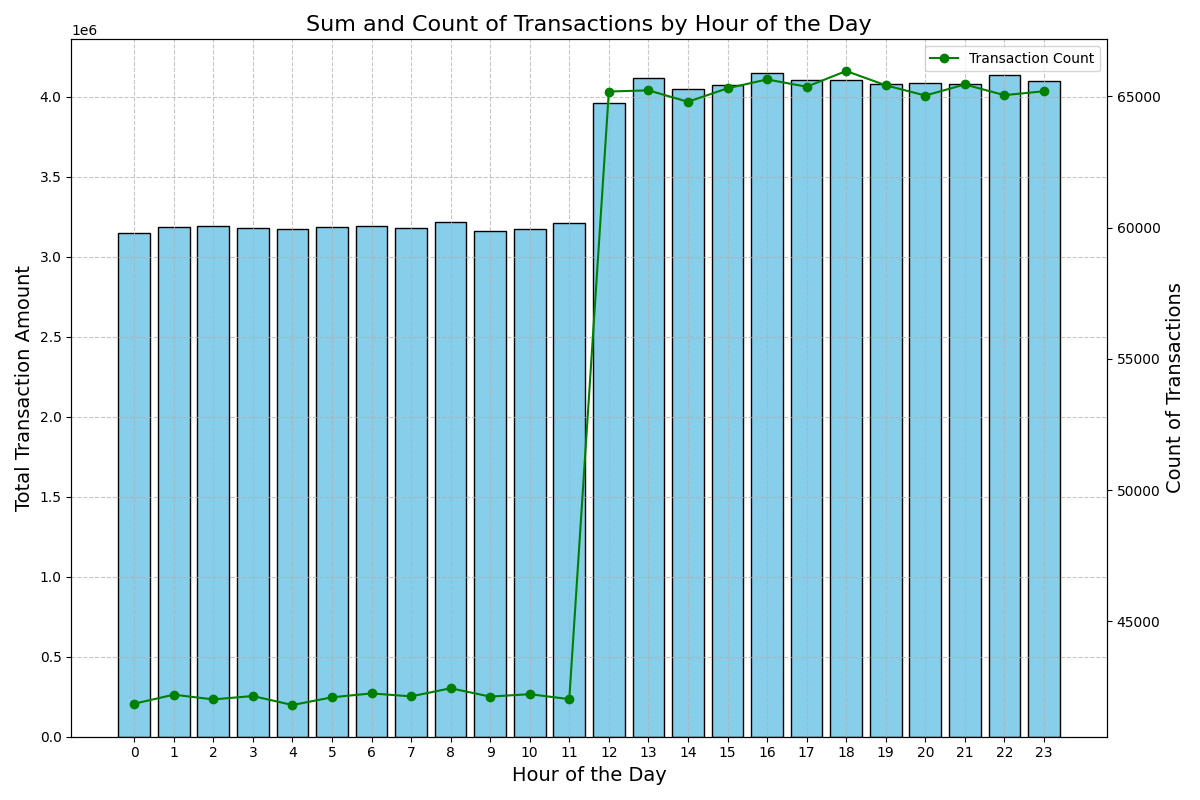
Credit cards are predominantly used on Sundays, Mondays, and Saturdays, with the highest usage occurring between 12:00 P.M. and 12:00 A.M.
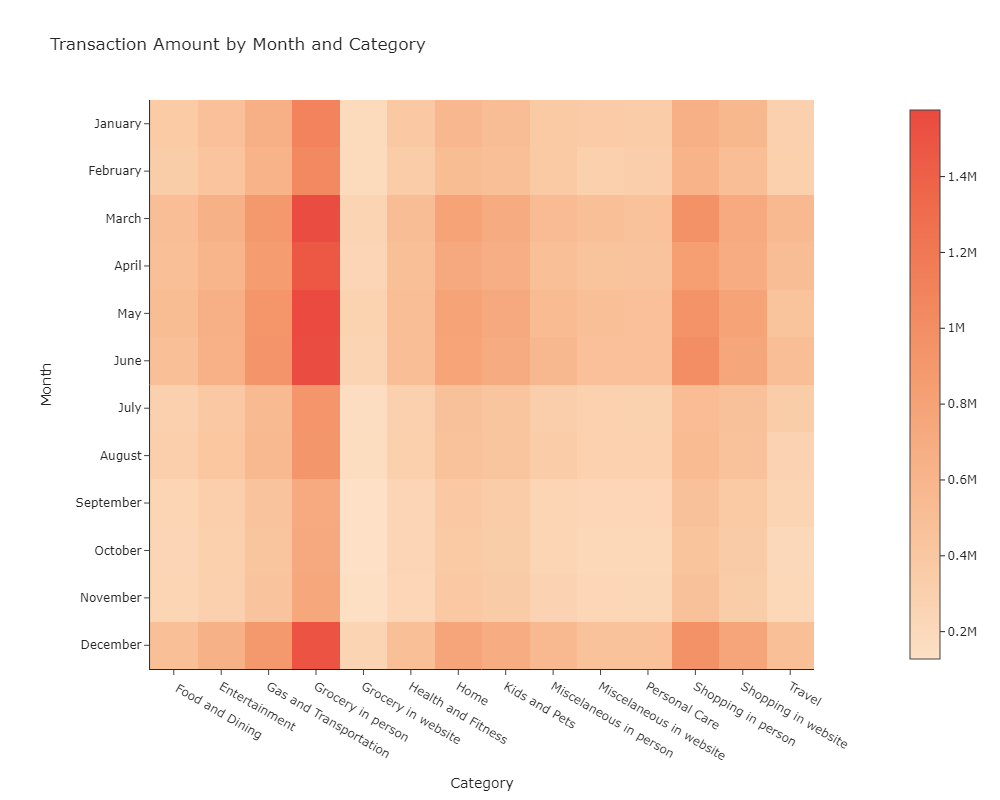
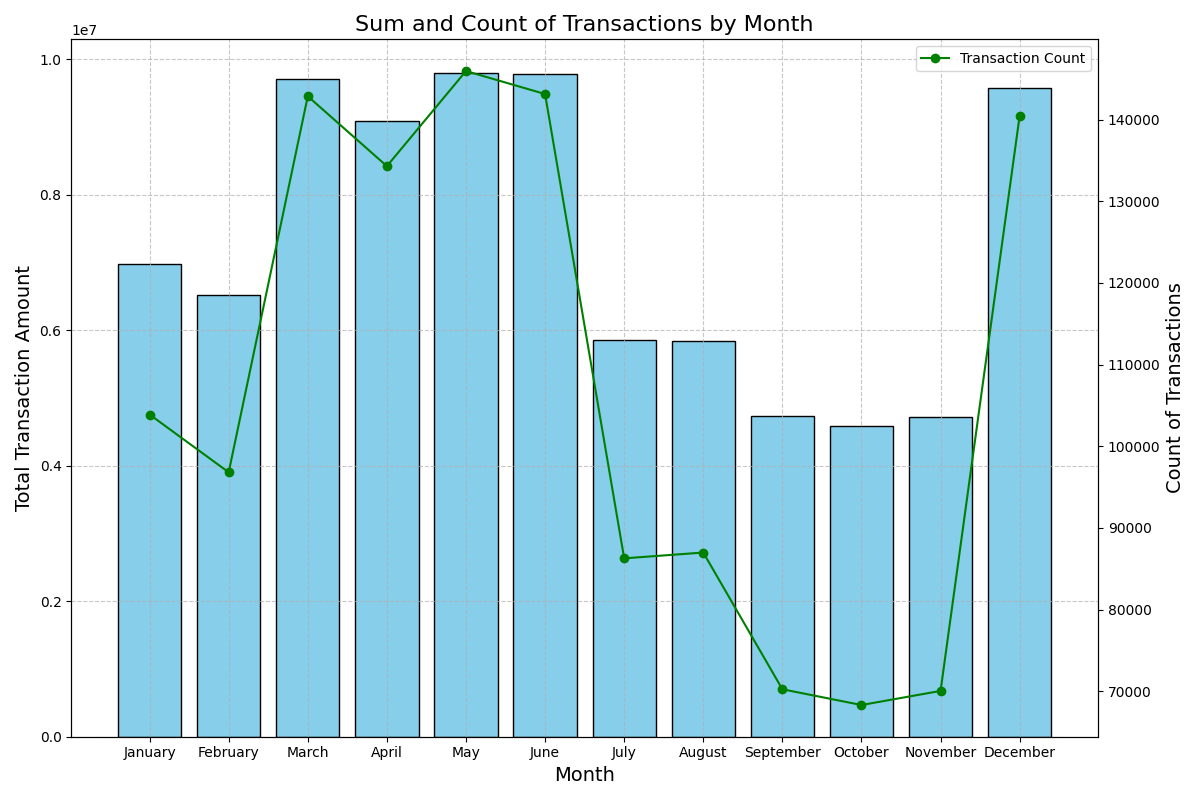
Credit Card usage in the U.S. may increase from March to June due to tax refunds, travel, weddings, and spring-related sales. Additionaly, during December when there is a significant boost in credit card use due to holiday shopping, travel, and celebrations.
Both periods coincide with cultural and economic events that encourage higher levels of consumer spending.
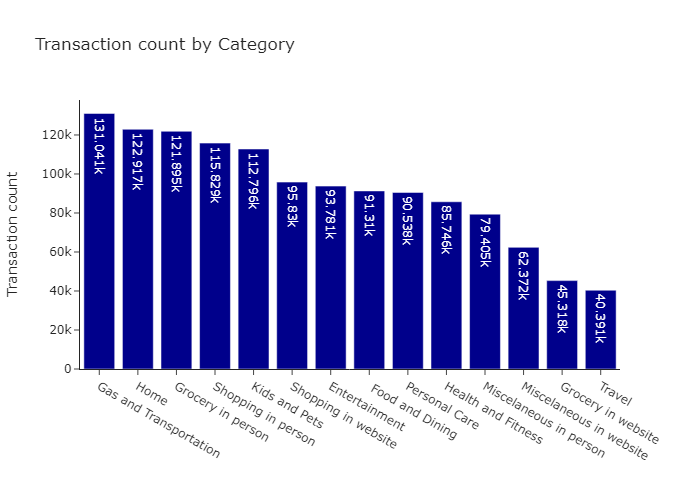
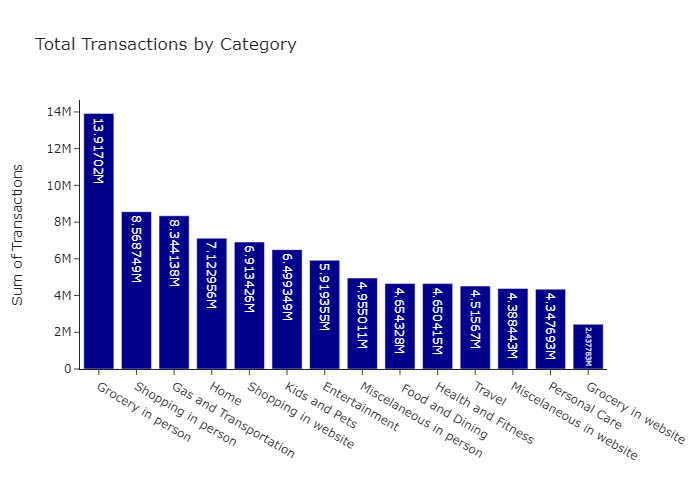
Credit cards are mainly used at gas and transportation stores, but the transaction amounts are higher at in-person grocery stores.
The average amount per transaction is twice for at in-person grocery stores, than for gas and transportation stores.
Credit Card Fraud Analysis
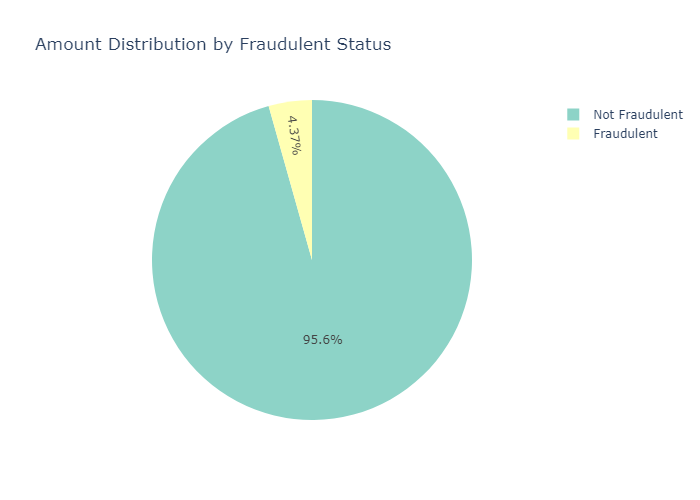
Although fraudulent transactions account for only 0.6% of the total number of transactions, they make up over 4% of the total transaction value. This highlights the importance of identifying the features linked to these transactions to more effectively flag them as fraudulent when they occur.
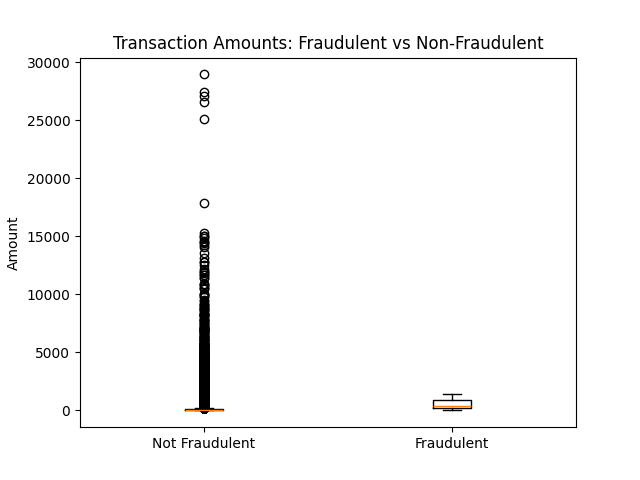
When analyzing the differences between fraudulent and non-fraudulent transactions, we can see that the spread for non-fraudulent transactions is narrower than that for fraudulent transactions.
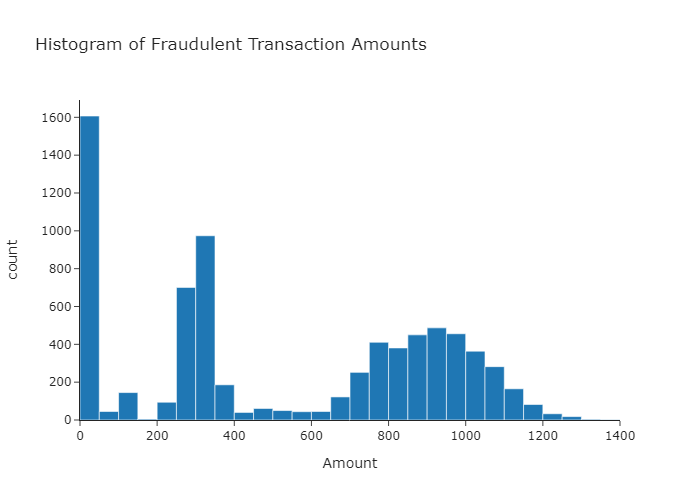
Most of the Fraudulent transactions are for charges of less than 50 USD and in the ranges of 200-400 and 650-1200. In rare ocassions is higher than 1200 USD.
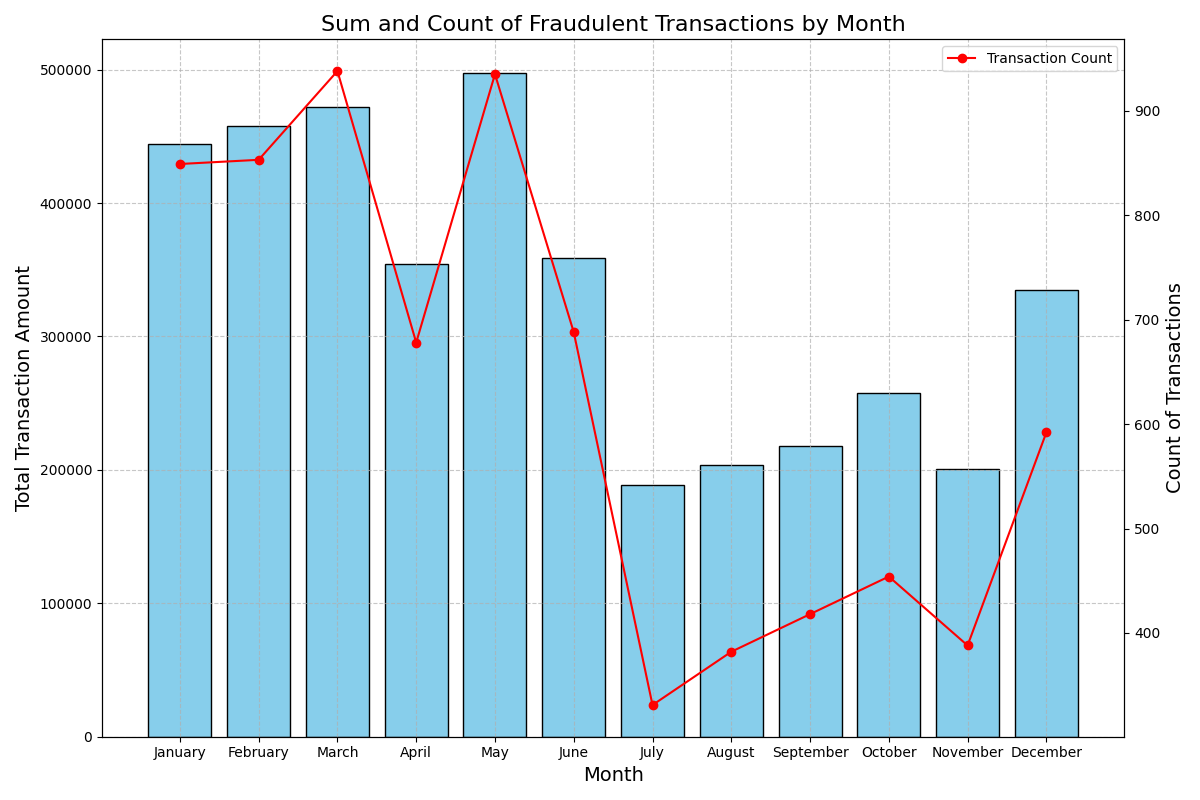
Fraudulent transactions appear to be more frequent in the first half of the year, particularly in May.
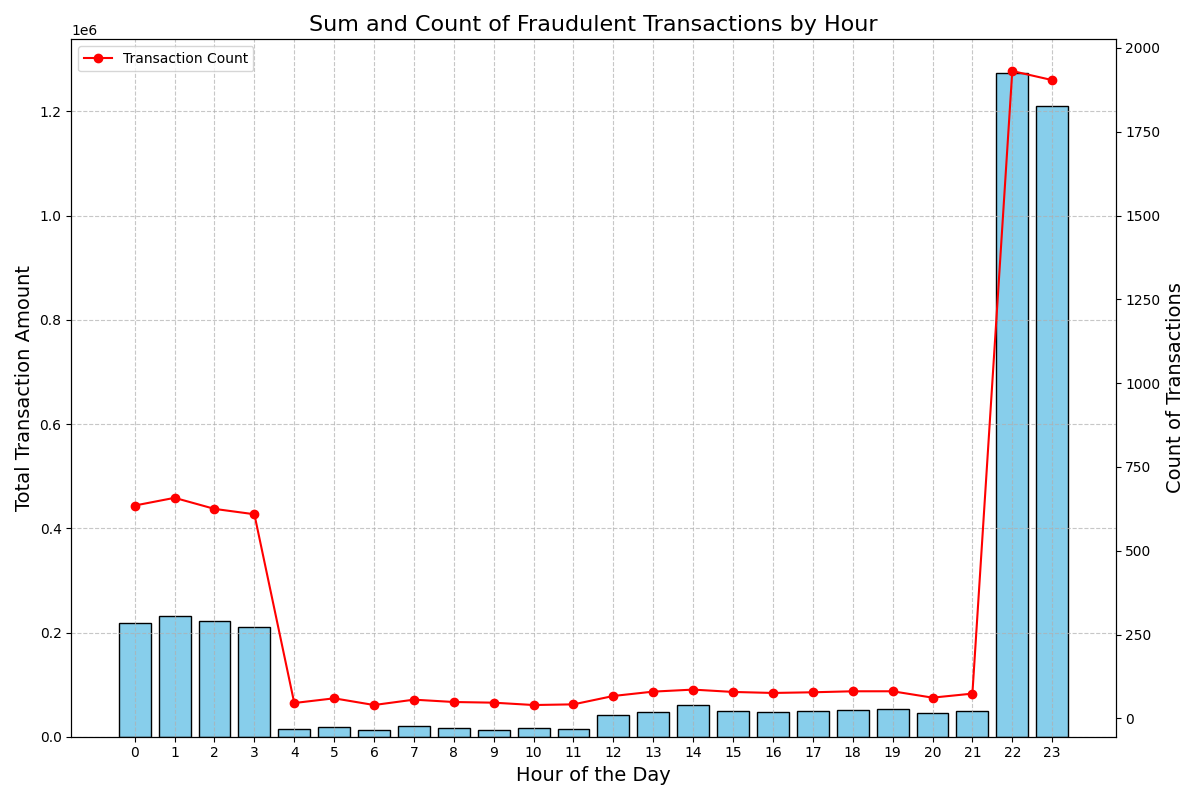
There is a notable surge in fraudulent transactions occurring between 10:00 P.M. and 12:00 A.M., especially during the weekends.
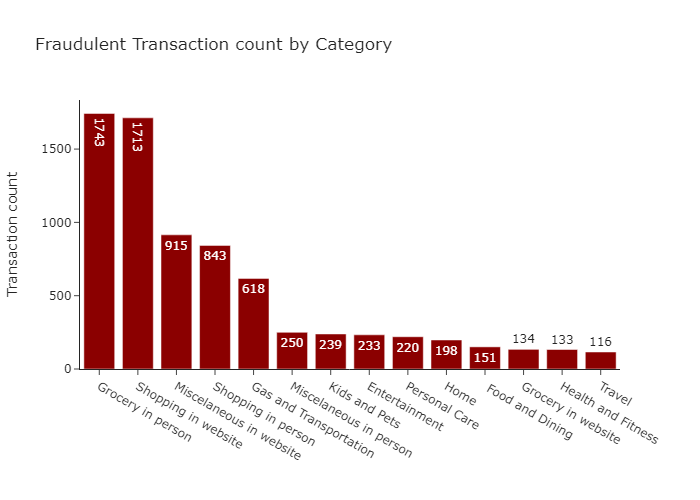
The number of fraudulent transactions is notably higher in the grocery in-person and online shopping categories. This trend suggests that both physical grocery stores and e-commerce platforms are increasingly vulnerable to fraudulent activities, underscoring the necessity for stronger security measures to protect consumers in these areas.
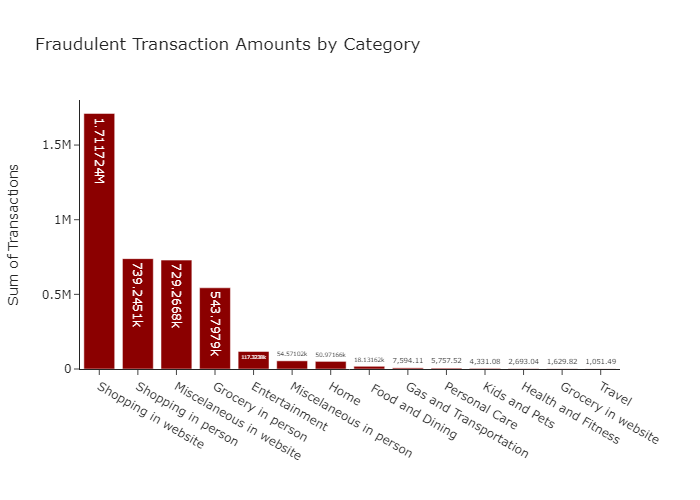
The total value of fraudulent transactions is greatest in the online shopping category, reaching double that of the second highest category, which is in-person shopping. This indicates a concerning trend, as more consumers may be exposed to fraud while making purchases on websites, highlighting the need for enhanced security measures in online transactions.
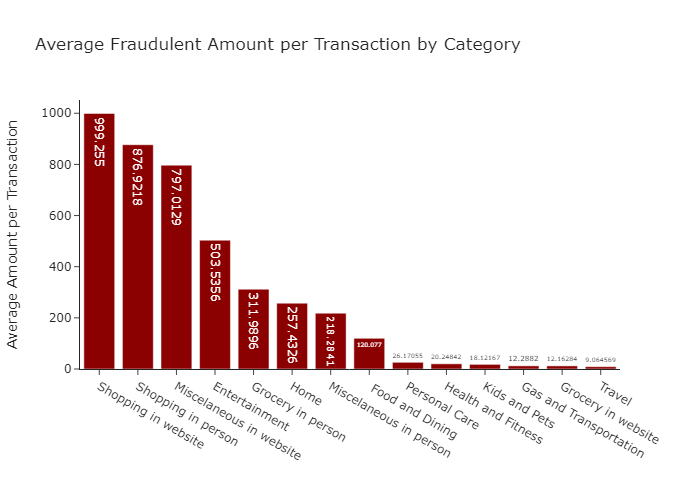
The Average of the amount of Fraudulent transactions can be as high as 1,000 USD. The top three categories are: Shopping in websites, Shopping in person and Miscelaneous in website.
Machine Learning: Decision Tree
Preprocessing steps:
- The unnecessary columns such as: name, transaction number and date of birth of the cardholder, were dropped from the initial DataFrame.
- To reduce the ‘High Cardinality’ of some columns, the infrequent categories were grouped into ‘Other’.
- Since, Decision Tree models require categorical data, the numerical data was transformed using LabelEncoder.
- The dataset was splitted into training (70%) and testing (30%) sets.
- The model is trained using a DecisionTreeClassifier.
Results:
The accuracy of the model for the testing data is 0.997; which is considered very high, although, the dataset is imbalanced with more than 99% of the data considered as Not Fraudulent. This can result in misleading conclussions about how accurate the model really is.
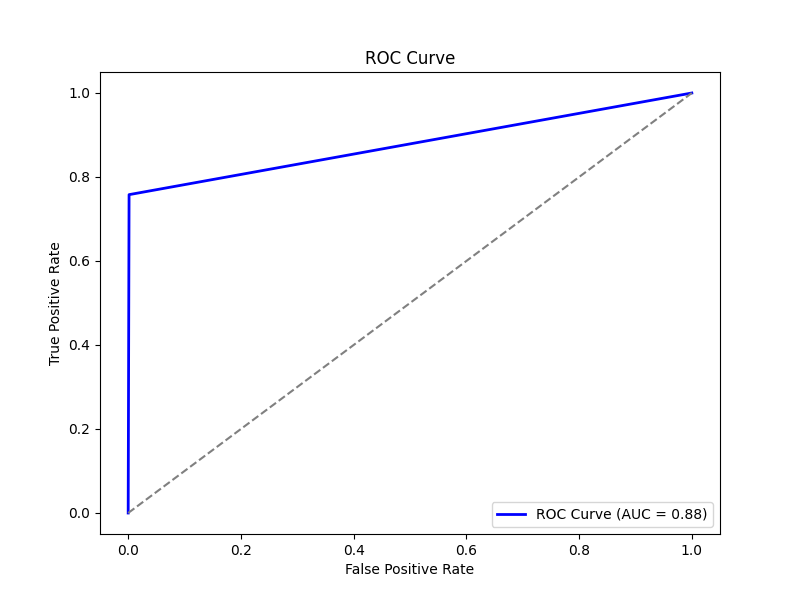
An AUC of 0.88 indicates that the model is effective at distinguishing between Fraudulent and Not Fraudulent transactions, but there is still room for improvement. This is crucial in fraud detection, where misclassifying a small number of fraudulent transactions can have significant consequences.
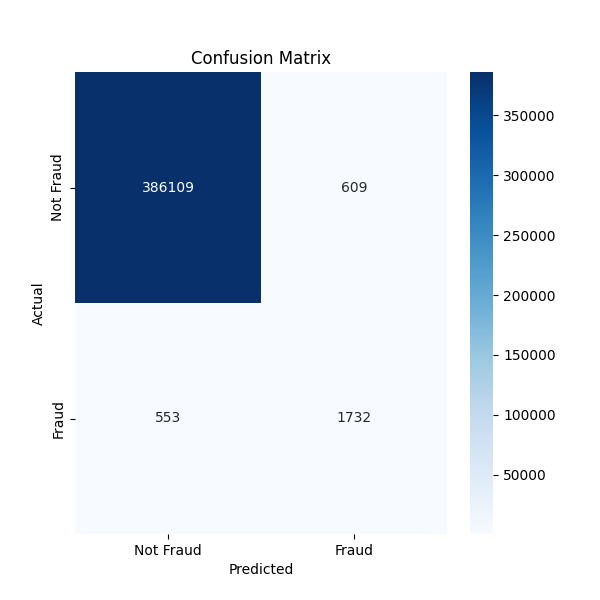
A Confusion Matrix is used to understand the model’s classification capability. Despite having an accuracy of 0.99, the highly imbalanced data causes some concerns when assesing the False Positive and False Negative predictions.
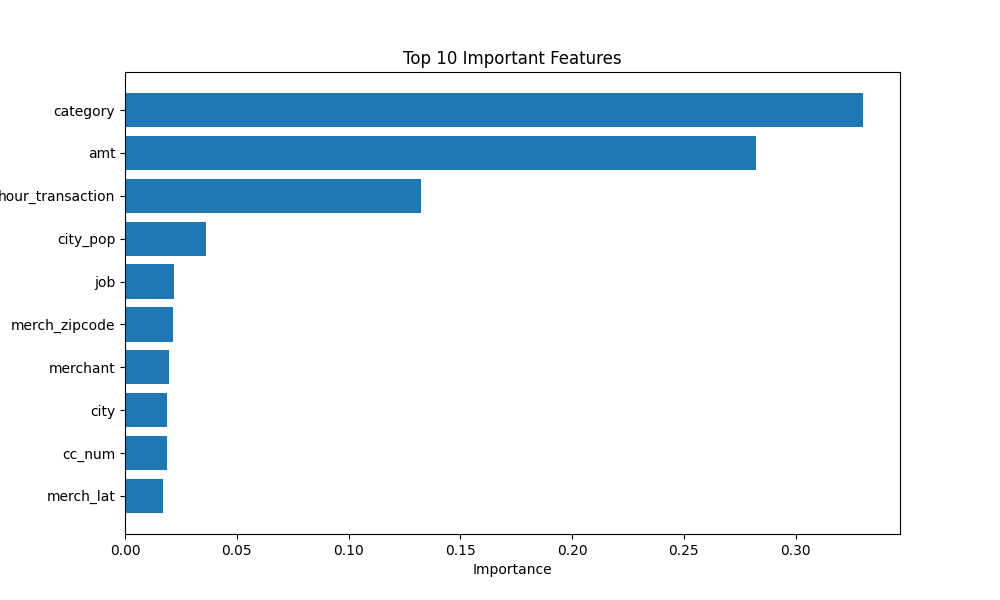
The Decision Tree model provides feature importance scores indicating which features contribute most to predicting fraud. Higher importance scores suggest that these features are more influential in distinguishing Fraudulent from Not Fraudulent transactions.
The Top three features are:
- Category: The Online shopping category is the most common in Fraudulent transactions.
- Amount: Most of the Fraudulent transactions are for charges of less than 50 USD and in the ranges of 200-400.
- Hour of the transaction: There is a notable surge in fraudulent transactions occurring between 10:00 P.M. and 12:00 A.M., especially during the weekends.
Conclusion
This project focused on developing a machine learning model to predict fraudulent credit card transactions, with an emphasis on tackling the challenges posed by a highly imbalanced dataset—where over 99% of the transactions were labeled as Not Fraudulent. This imbalance has the potential to bias the model towards predicting the majority class, leading to under-detection of Fraudulent transactions.
Exploratory Data Analysis (EDA) on Non-Fraudulent Transactions:
As part of the exploratory data analysis (EDA), I examined the spending patterns of Not Fraudulent transactions to gain insights into typical consumer behavior:
- Spending Patterns by Day: Not Fraudulent transactions were most frequent on Mondays, Sundays, and Saturdays, indicating that weekends and the beginning of the workweek see the highest levels of legitimate spending activity.
- Transaction Time: The peak time for Not Fraudulent spending occurred after 12:00 P.M.
- Transaction Amount: The majority of Not Fraudulent transactions had lower amounts, particularly under $10.
- Top Categories: Non-fraudulent transactions were most frequent in the Gas and Transportation, Home ,and Grocery in person categories. This aligns with typical consumer behavior where essential purchases like fuel and food dominate everyday spending.
Fraudulent Transaction Analysis:
The fraudulent transactions analysis revealed key characteristics:
- Category Distribution: Fraudulent transactions were concentrated in the online shopping category, which accounted for the largest sum of fraudulent amounts, nearly twice that of the next highest category, in-person shopping. This underscores the vulnerability of e-commerce platforms to fraud, where large purchases are often made.
- Transaction Amount: The most common fraudulent transaction amount was less than $50. This may indicate that fraudsters attempt to avoid detection by keeping transaction amounts low, possibly flying under the radar of typical fraud monitoring systems.
- Time of Occurrence: A significant peak in fraudulent activity was observed between 10:00 P.M. and 12:00 A.M., especially on weekends, suggesting that fraudsters may target late-night hours when consumers are less likely to monitor their accounts.
Model Performance:
The model used for fraud detection is a Decision Tree, which delivered the following performance:
- Accuracy: 99.7%
- AUC (Area Under the Curve): 0.88
While the model’s high accuracy reflects its ability to correctly classify the majority non-fraudulent class, the AUC of 0.88 highlights its strong capability to distinguish between fraudulent and non-fraudulent transactions, which is essential for effective fraud detection in such imbalanced data.
Recommendations and Next Steps:
- Explore Additional Algorithms: Investigate other algorithms like Random Forest and K-Nearest Neighbor.
- Feature Engineering: Incorporate new features or transform existing ones to capture more complex patterns associated with fraud.
By identifying key differences in fraudulent transactions, such as the tendency for smaller amounts and specific time frames, the model provides actionable insights to help financial institutions strengthen fraud detection and safeguard consumer transactions.